Showing posts with label inflation. Show all posts

Saturday, May 18, 2013

Third Refinance

Yesterday, I closed on my third refinance. This is my fourth loan for the house in just over 6 years of owning it (http://eis271828.blogspot.com/2007/05/house-closing.html). I opted for a 15-year loan at 3.000% interest, which was the no-cost refinance rate. My out-of-pocket costs were #3115.86, which included $1549.21 in principal reduction, because I wanted the new loan to be a nice round $200K, and the customary prepaid interest and escrow pre-funding. I should get $1,433.34 refunded from my old escrow in awhile. Not too bad.

The 3% interest rate is lower than my estimated long-term rate of inflation (http://eis271828.blogspot.com/2010/08/annualized-inflation.html), which means I am borrowing money for free! The principal portion of my payment is also hugely higher than the interest portion, which makes me all kinds of happy inside. Because I was paying slightly extra on my old loan, my new payment is only about $20 more per month. I will not be paying anything extra toward this mortgage. Except, I am guessing that as I approach the end of the term, I will want to get rid of the monthly payment and still pay it off early.

I also have a nice happy feeling because I just helped the economy! For the most part, mortgages are owned by wealthy companies/individuals, and I lowered the interest rate they're earning from 4% to 3%. My local broker got some extra income, the state of Kansas got some extra fees, and everyone came out ahead!

Friday, September 3, 2010

Q&A: Should I Pay Down Extra Principal Each Month?

Whether or not to pay down extra principal each month is a complicated question, and one that doesn't have a universal answer by any means. For the purposes of this discussion, we'll assume that an extra payment fits in your budget. Otherwise, the question is a bit moot.

Paying down principal has two primary effects. First, it takes money out of your pocket. Second, it increases your equity. Increasing your equity has the effects of reducing the interest you pay over the life of your loan and increasing your borrowing power. We'll go backwards through these effects this time around.

The borrowing power I'm referring to here will usually take the form of a home equity line of credit (HELOC). If you make a larger down payment, your monthly expenses can be lower, which can increase your borrowing power for a new loan, but if you're just getting a mortgage, chances are you're not looking for many other new loans. (Indeed, you shouldn't be, as new loan credit inquiries can negatively affect your credit score! Wait for your mortgage to be finalized before looking at car loans, for example.) The only thing I would use a HELOC for is an emergency fund. It's a great way to be able to pay down principal and still have access to that money in a pinch. If the pinch comes and you don't already have a HELOC, you're unlikely to be able to get a HELOC, so it's important to plan ahead. HELOCs are usually restricted to whatever equity you've built beyond 20%, so that your combined LTV remains at 80% or less. They also usually require a recent appraisal, so even the no-fee HELOCs aren't entirely cost-free to set up.

To me, though, this benefit of paying down principal isn't a major selling point, as evidenced by the fact that I do not have a HELOC. For emergency funds beyond my cash on hand, I would rely on loans from my family. I haven't formalized that line of credit in any way, and maybe I should do so rather than taking it for granted. At the same time, I can make sure my family knows that I would be there for them, too.

I view principal reduction as an investment that returns a savings in interest payments. Unfortunately, the rate of return on that investment isn't always just the interest rate of your mortgage. I included a simple calculator in my post on your effective mortgage interest rate, but that doesn't give a complete picture of your investment.

First, just as in my discussion on S&P 500 growth, values were not inflation adjusted. When it comes to the returns of the S&P 500, you have to subtract the inflation rate to get an inflation-adjusted return (approximately, anyway). Your mortgage works much the same way except that inflation helps debt, so you get to subtract the inflation rate from the interest rate you pay and get an inflation-adjusted interest rate. You get a benefit now (the home) and pay for it with less and less valuable dollars. Not a bad deal for the purchase, but it lowers the rate of return on principal payments. For the default values in the calculator above, the effective interest rate is 3.75%. After adjusting for inflation by subtracting 3.3% (though recent inflation has been lower), you're left with a nice low 0.45% inflation-adjusted effective interest rate.

Second, paying down principal now takes off interest from the very end of the loan. Your minimum payment doesn't go down and you can't readily access that money except through a HELOC. It is definitely a long-term investment, and the rate of return is locked for that entire period. It's similar to buying a multi-year CD with a rather - even ridiculously - low rate, given the current interest rate environment.

Third, paying down principal really shows the nature of compounding. Every payment that goes by, the principal you pay down saves you one fewer compounding of interest. Take a look at a monthly amortization schedule (my favorite calculator). You'll notice that the principal you pay goes up each month, while the interest paid goes down. Where you are in the schedule depends entirely on the principal outstanding, so to move up the schedule by a month (and in effect take a payment off the back end), you just have to pay the principal for the next month ahead of time. Thus, the extra payment required to gain a month goes up each time. The rate of return doesn't go down, but the time horizon is shortened and the compounding reduced. If that shortening of the time horizon is your goal, there are definitely diminishing returns.

As mentioned above, paying principal takes money out of your pocket. Whether or not paying principal is a good investment really depends on which pocket the money comes from. If it's coming from a cash account, chances are good that you will get a larger return by eliminating interest. If you are paying extra principal instead of making an IRA or 401(k) contribution or otherwise investing, then you are missing out on what is very likely to be a higher return in the stock market. Remember that it is important to compare inflation-adjusted rates to each other, and non-inflation-adjusted rates to each other. Mixing and matching is not a valid comparison.

Basically, as near as I can tell, prepaying principal doesn't make financial sense unless mortgage interest rates are over ten percent or so. I don't think many people today would pay down their mortgage if it weren't for the psychological benefits. Being in debt just doesn't feel very good - especially when it's tens or hundreds of thousands of dollars and can result in being homeless. Conversely, there's no feeling quite like knocking another month off the end of your mortgage. It's also a lot of fun to reduce your principal by the first $1,000; the first $10,000; the first $100,000 (I imagine). I'm also really looking forward to the day (soon, I think!) when my various investment and cash accounts could pay off my mortgage if I liquidated them. That would mean I could pay off the house if I had to, significantly lowering my monthly expenses so that I could live off a minimum wage job, for example. However, when I get close to the end of my mortgage, I imagine that I will pay it off simply for the monthly cash flow improvement, whether I need it or not.

In the end, I pay a couple hundred extra each month despite the logic behind investing it instead. I guess that's the price I put on the psychological benefits above. Pretty cheap therapy, actually.

Wednesday, August 25, 2010

Infinite Retirement Calculator

As you may know, I plan on living forever. Dying just seems so wasteful, so I think I'll skip that part of life. Living forever requires some planning, though. It'd be rather annoying to retire and then be forced back into the workforce at age 2718 because I ran out of money. Every retirement calculator I've ever found requires you to choose how long you will be retired. The longest option I've seen is 120 years, but even that's rather pessimistic. So then, I need to know how much money I need to save up in order to retire - forever. Alternatively, I'd like to know how much I can take out every year given my current investments.

I tried to be as conservative as possible in my planning. I assumed I would take out the entire year's spending money at the beginning of the year, i.e., I was pessimistic about how much of my net worth would grow each year. Of course, this pesky little recession has shown that I'm being ridiculously optimistic by assuming any sort of consistent growth during my retirement. Still, this is for planning purposes only, and certain assumptions have to be made in order to make the math at all reasonable.

So, without further ado, the calculator!

  • Modify either the "Net worth" or the "Max sustainable income" field and the other will be calculated.
  • "Growth rate" and "Inflation rate" are configurable as well.
  • The bold label indicates the calculated value.
Net worth ($):
Growth rate (%):
Inflation rate (%):
Max sustainable income ($):
Monthly values?

For every $0.00 you save, your eternal retirement income increases by $1.00.

Some following ado is in order. It should be noted that the "Net worth" and "Max sustainable income" values are in current dollars. The amount you withdraw is assumed to adjust for inflation each year; your infinite retirement should maintain a consistent quality of life. Since money equals happiness, this means your purchasing power should remain the same no matter how long you live. Similarly, the "Net worth" (when calculated) is how much you would need today in order to retire. The amount you need goes up each year, since your income requirements get larger as you postpone your retirement, but most of the difference should be accounted for in the principal growth that would be occurring. It should also be noted that the amount you have to save per dollar is entirely dependent on the growth and inflation rates, so these are rather important to estimate right (and/or conservatively).

Observant readers may have noticed that the default inflation rate of 3.3% closely matches the annualized inflation rate discussed previously. They may have also noticed that the default growth rate of 7% does NOT match any of the numbers in my discussion on the annualized growth rate. I chose 7% because this calculator models retirement, and people tend to be more conservative in their retirement. I think 7% is a better reflection of a portfolio with a significant percentage allocated to bonds, for example.

The "Net worth" label is probably a bit misleading, but it gives you a good place to start. I would probably not include my home equity in these calculations because I don't plan on using that for income in any way. Similarly, cash accounts won't come close to the average growth most people assume in their models, and would probably best be ignored. I would have used "Retirement savings" except that term is usually used to refer to 401(k) and IRA accounts, and regular taxable accounts can grow and produce income, too.

Growth and inflation rates are APY values. The default values reflect yearly budgeting, and for yearly values, APR=APY and things are simple. When the "Monthly values?" checkbox is checked, the growth and inflation rates are adjusted such that the APY remains the same as for the yearly case, other than rounding errors. When looking at monthly values, your overall income will still be higher (or your net worth needed lower) because you are leaving your money growing a few months longer.

Friday, August 20, 2010

Annualized Inflation

Knowing the current inflation rate is helpful in making short term decisions. Seeing a table of historical inflation rates is only slightly productive. For long term planning, what we're really interested in is the annualized inflation over a period of time. Sure, some years inflation may skyrocket to 20%, but other years it's flat or even negative. Taken together, they should be equivalent to one inflation rate applied each year. This annualized inflation rate (or geometric mean, or Compound Annual Growth Rate [CAGR]) is probably a good value to use when modeling inflation far into the future.

I found some great information over at InflationData.com, but I couldn't find any information on average or annualized inflation. I found a calculator at MeasuringWorth.com, but that also wasn't terribly useful except to give me a single final result. Then I found Peter Dolph on average inflation, but that was unclear whether it gave an average year-over-year inflation, which didn't make as much intuitive sense, or the geometric mean. So, I decided to compute it myself.

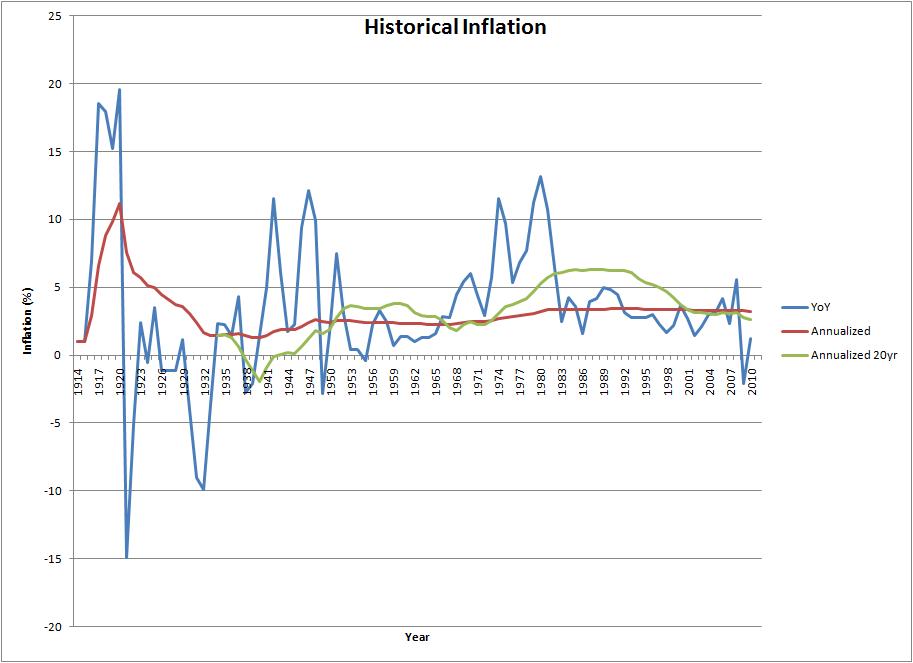
Since I love data, I started with the raw CPI data (see one of the tables below). I then computed the annualized inflation rate from 1913 up until each data point using the same month (or average, in the annual case) in each year. Looking at the table, things appeared to level out, so I decided to verify that with a graph! Not content with that, I then added the year-over-year inflation data for comparison purposes. Not content with that, I then computed and added a sliding 20-year window of annualized inflation rates.

The graph above (click for full size) shows the year-over-year inflation rate, a sliding 20-year annualized inflation rate, and an overall annualized inflation rate. Below, you can toggle between the raw CPI data and the overall annualized inflation rate table. The month of July was used for the graph for the simple reason that it was the most recent month data was available for this year. Also, the average 20-year annualized inflation rate was 3.236% compared to the overall annualized rate of 3.239% at the end of July, 2010, and compared to the 3.26% Peter Dolph found to be the average. Things seem to be pretty consistent.

"What about the risk of hyperinflation?" you may ask. Hyperinflation would indeed be bad, but I don't think it's particularly useful to worry about. If hyperinflation hits us, the world economy is likely completely broken and no amount of planning will help. You could argue that real goods like precious metals would hold their value, but I think owners of gold, for example, will have a hard time taking possession of that gold. Just a theory.

So, 3.3% is a pretty reasonable assumption for long term inflation, arrived at using various methods. This should give us some confidence when we create long term models and/or plans!

Display Annualized Inflation Table